
Description:
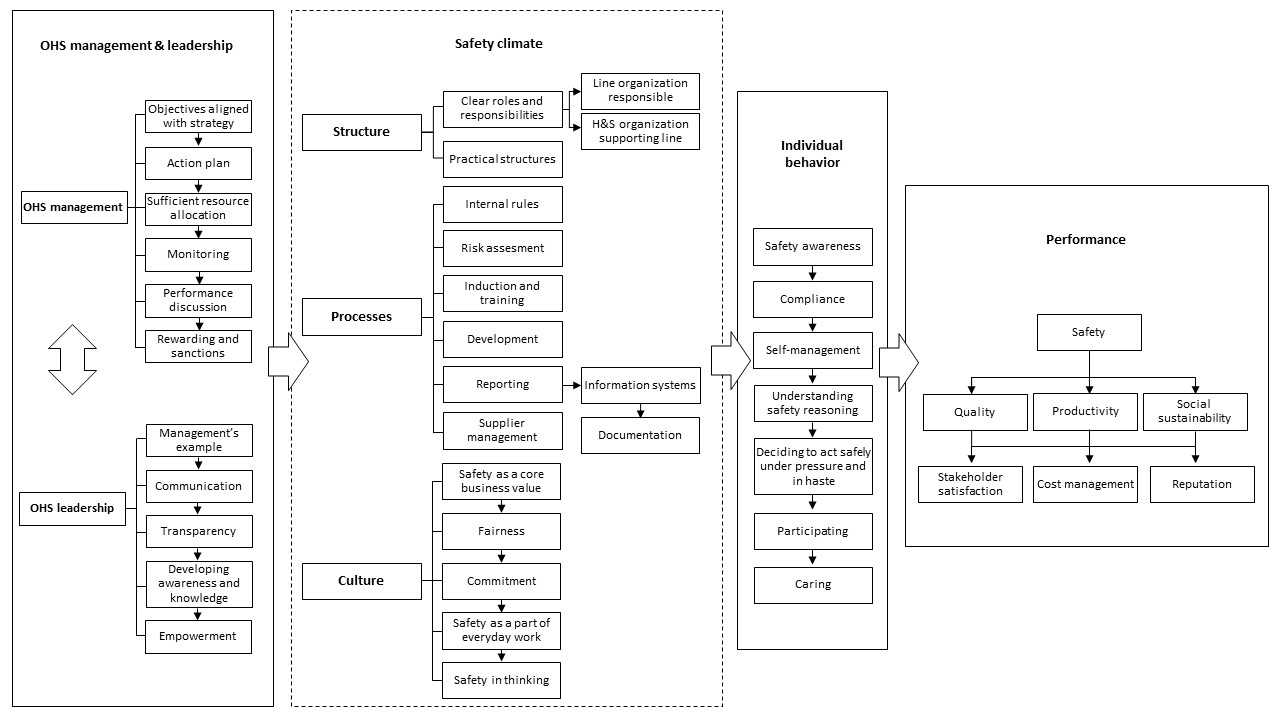
The safety performance map is a a generalizable framework for safety management, that determines the essential factors contributing to safety performance and shed light on what factors a company could measure to realize the potential of the measurement data.
How to apply:
The idea is to use the map as a basis for analyzing the status of performance measurement (i.e., which aspects of the map are measured) and designing a more balanced measurement systems for safety.
To do this:
- Link the indicators currently used in your organization to suitable factors on the map.
- Notice which essential factors are left with less attention in your safety measurement.
- See Proactive Indicators in Relation to Safety Factors to get ideas on what indicators to use to increase your organization’s proactive measurement and expand your measurement system to cover different factors comprehensively.
Other possible uses:
- Use as a as a basis for analyzing the status of safety management and identifying means for developing safety (e.g., which factors explain the changes of lagging indicators representing the perspectives on the right-hand side of the map).
- Use as a help in forming hierarchies in information systems and reports
- Use to support the implementation of safety strategies
- Use in the allocation of health and safety budgets by highlight the linkage between safety investments and performance impacts
Background:
The overall picture of the factors related to the improvement of occupational health and safety is unclear, as in academic literature, the focus has typically been on describing shorter relations or individual factors of smaller entities, rather than describing the whole chain in a detailed level.
In this sub-study of the SafePotential project, a general level theoretical framework that describes the main perspectives influencing safety performance was first created based on academic literature. The framework was then supplemented in the empirical phase of the study by a more detailed description.
The empirical part of the study was conducted as a qualitative multiple case study. Four companies from different industries participated in the creation of the safety performance map, and the map was later tested in three additional companies.
More on Haapavirta, R. (2020). Designing a map for analyzing and measuring safety performance. Master of Science Thesis, Tampere University.
Download the material as PDF files here
Download the Safety Performance Map
Download the Safety Performance Map (IN FINNISH)
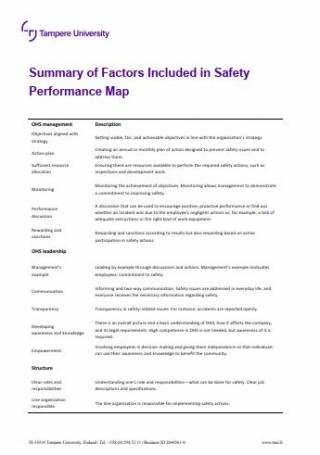
Download the Summary of Factors Included in Safety Performance Map
Download the Summary of Factors Included in Safety Performance Map (IN FINNISH)