
In the following videos:
The two plots on the left illustrate the positioning performance of a multi-target CPS (MT-CPS) (top plot -> 2D, bottom plot -> vertical) where there are two target-agents (T-ags) (cyan star and diamond markers) being involved, whereas the two plots on the right are the positioning performance of a single-target CPS (ST-CPS) where only one T-ag (cyan diamond marker) is considered. In both systems, we consider overall six anchor-agents (A-ags) which are collinear and non-collinear deployed. In addition, we assume that they are located on the same height, and illustrated with the red circle markers. Furthermore, the blue diamond and magenta star markers (on the left plots) are the estimated locations of the two T-ags with the proposed MT-CPS, while the red diamond marker (in the right plots) refers to the location estimates of the only T-ag with the ST-CPS. In both cases, the green ellipses are indicating the 95% uncertainty in the obtained location estimate. Additionally, the cross markers therein represent the estimated locations of the A-ags (solid lines with different colors are applied to connect the estimates with the corresponding A-ags in 2D plots).
Last but not least, the plots in the middle refer to the cumulative density function (CDF) of the positioning error on the 2D plane and vertical direction, in which, black curves are showing the estimation performance of the MT-CPS (solid for T-ags and dashed for A-ags), whereas the red ones are showing the estimation performance of ST-CPS (solid for T-ags and dashed for A-ags). We emphasize that the results presented in the videos applies for this specific realization only, and therefore, the performance cannot be directly generalized.
The parameters utilized in the simulation:
The OFDM-based pilot signal is transmitted at 26 GHz with 10 MHz bandwidth (60 kHz sub-carrier spacing) and 10 dBm transmit power. Meanwhile, a 8 x 8 URA is assumed for each A-ag. The update time-interval is set at 100ms.
The location-related measurements (LRMs) utilized in the positioning are time of arrival (ToA), angle of arrival (AoA) and time difference of arrival + angle of arrival (TDoA+AoA), and they are shown in the titles of both 2D plots.
This work can be found as:
Y. Lu, M. Koivisto, J. Talvitie, E. Rastorgueva-Foi, M. Valkama and E. S. Lohan, “Cooperative Positioning System for Industrial IoT via mmWave Device-to-Device Communications”, submitted to IEEE 93rd Vehicular Technology Conference (VTC2021-Spring).
Video 1
Video 2
CPS applied in an industrial environment
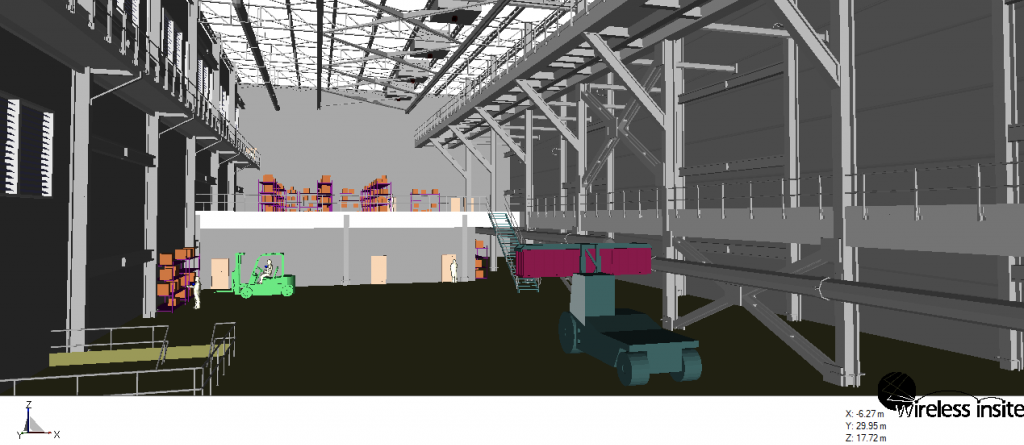
Figure 1. Industrial factory warehouse generated by Wireless Insite, Remcom, Inc.
In this case study, a realistic industrial factory warehouse scenario with advanced ray-tracing simulations is applied to demonstrate the positioning performance of the CPS. For a consistent comparison, there are 6 collinear deployed A-ags located in the middle of the warehouse hall. Each A-ag is equipped with two 3GPP-specified 8×8 antenna array panels [1], which are oriented with opposite azimuth angles so that the panel directions are aligned with the imaginary line between the A-ag locations. For simulating realistic radio wave propagation, Wireless InSite 3D-ray-tracing tool by Remcom Inc. is utilized with a high-detailed structural description of the considered factory warehouse. Both ST-CPS and MT-CPS are considered, where the T-ags are defined as drones flying at constant altitude around the warehouse hall.
It is noteworthy that the line-of-sight (LoS) paths between T-ags and A-ags, which are available for the most of the time, are blocked at certain time instants, in which cases, the LRMs for positioning (i.e., ToA and AoA) are not available. Furthermore, the LRMs at the A-ags are acquired based on 5G NR sounding reference signals [2], which are regularly transmitted by the T-ags over different beams via sidelink channel over 100 MHz bandwidth [3]. The AoA is estimated by observing power differences between separate receive beams via beam sweeping, and the ToA is estimated by calculating the phase differences between separate sub-carriers of the received OFDM signal. An illustration of the considered factory warehouse scenario is shown in figure below.
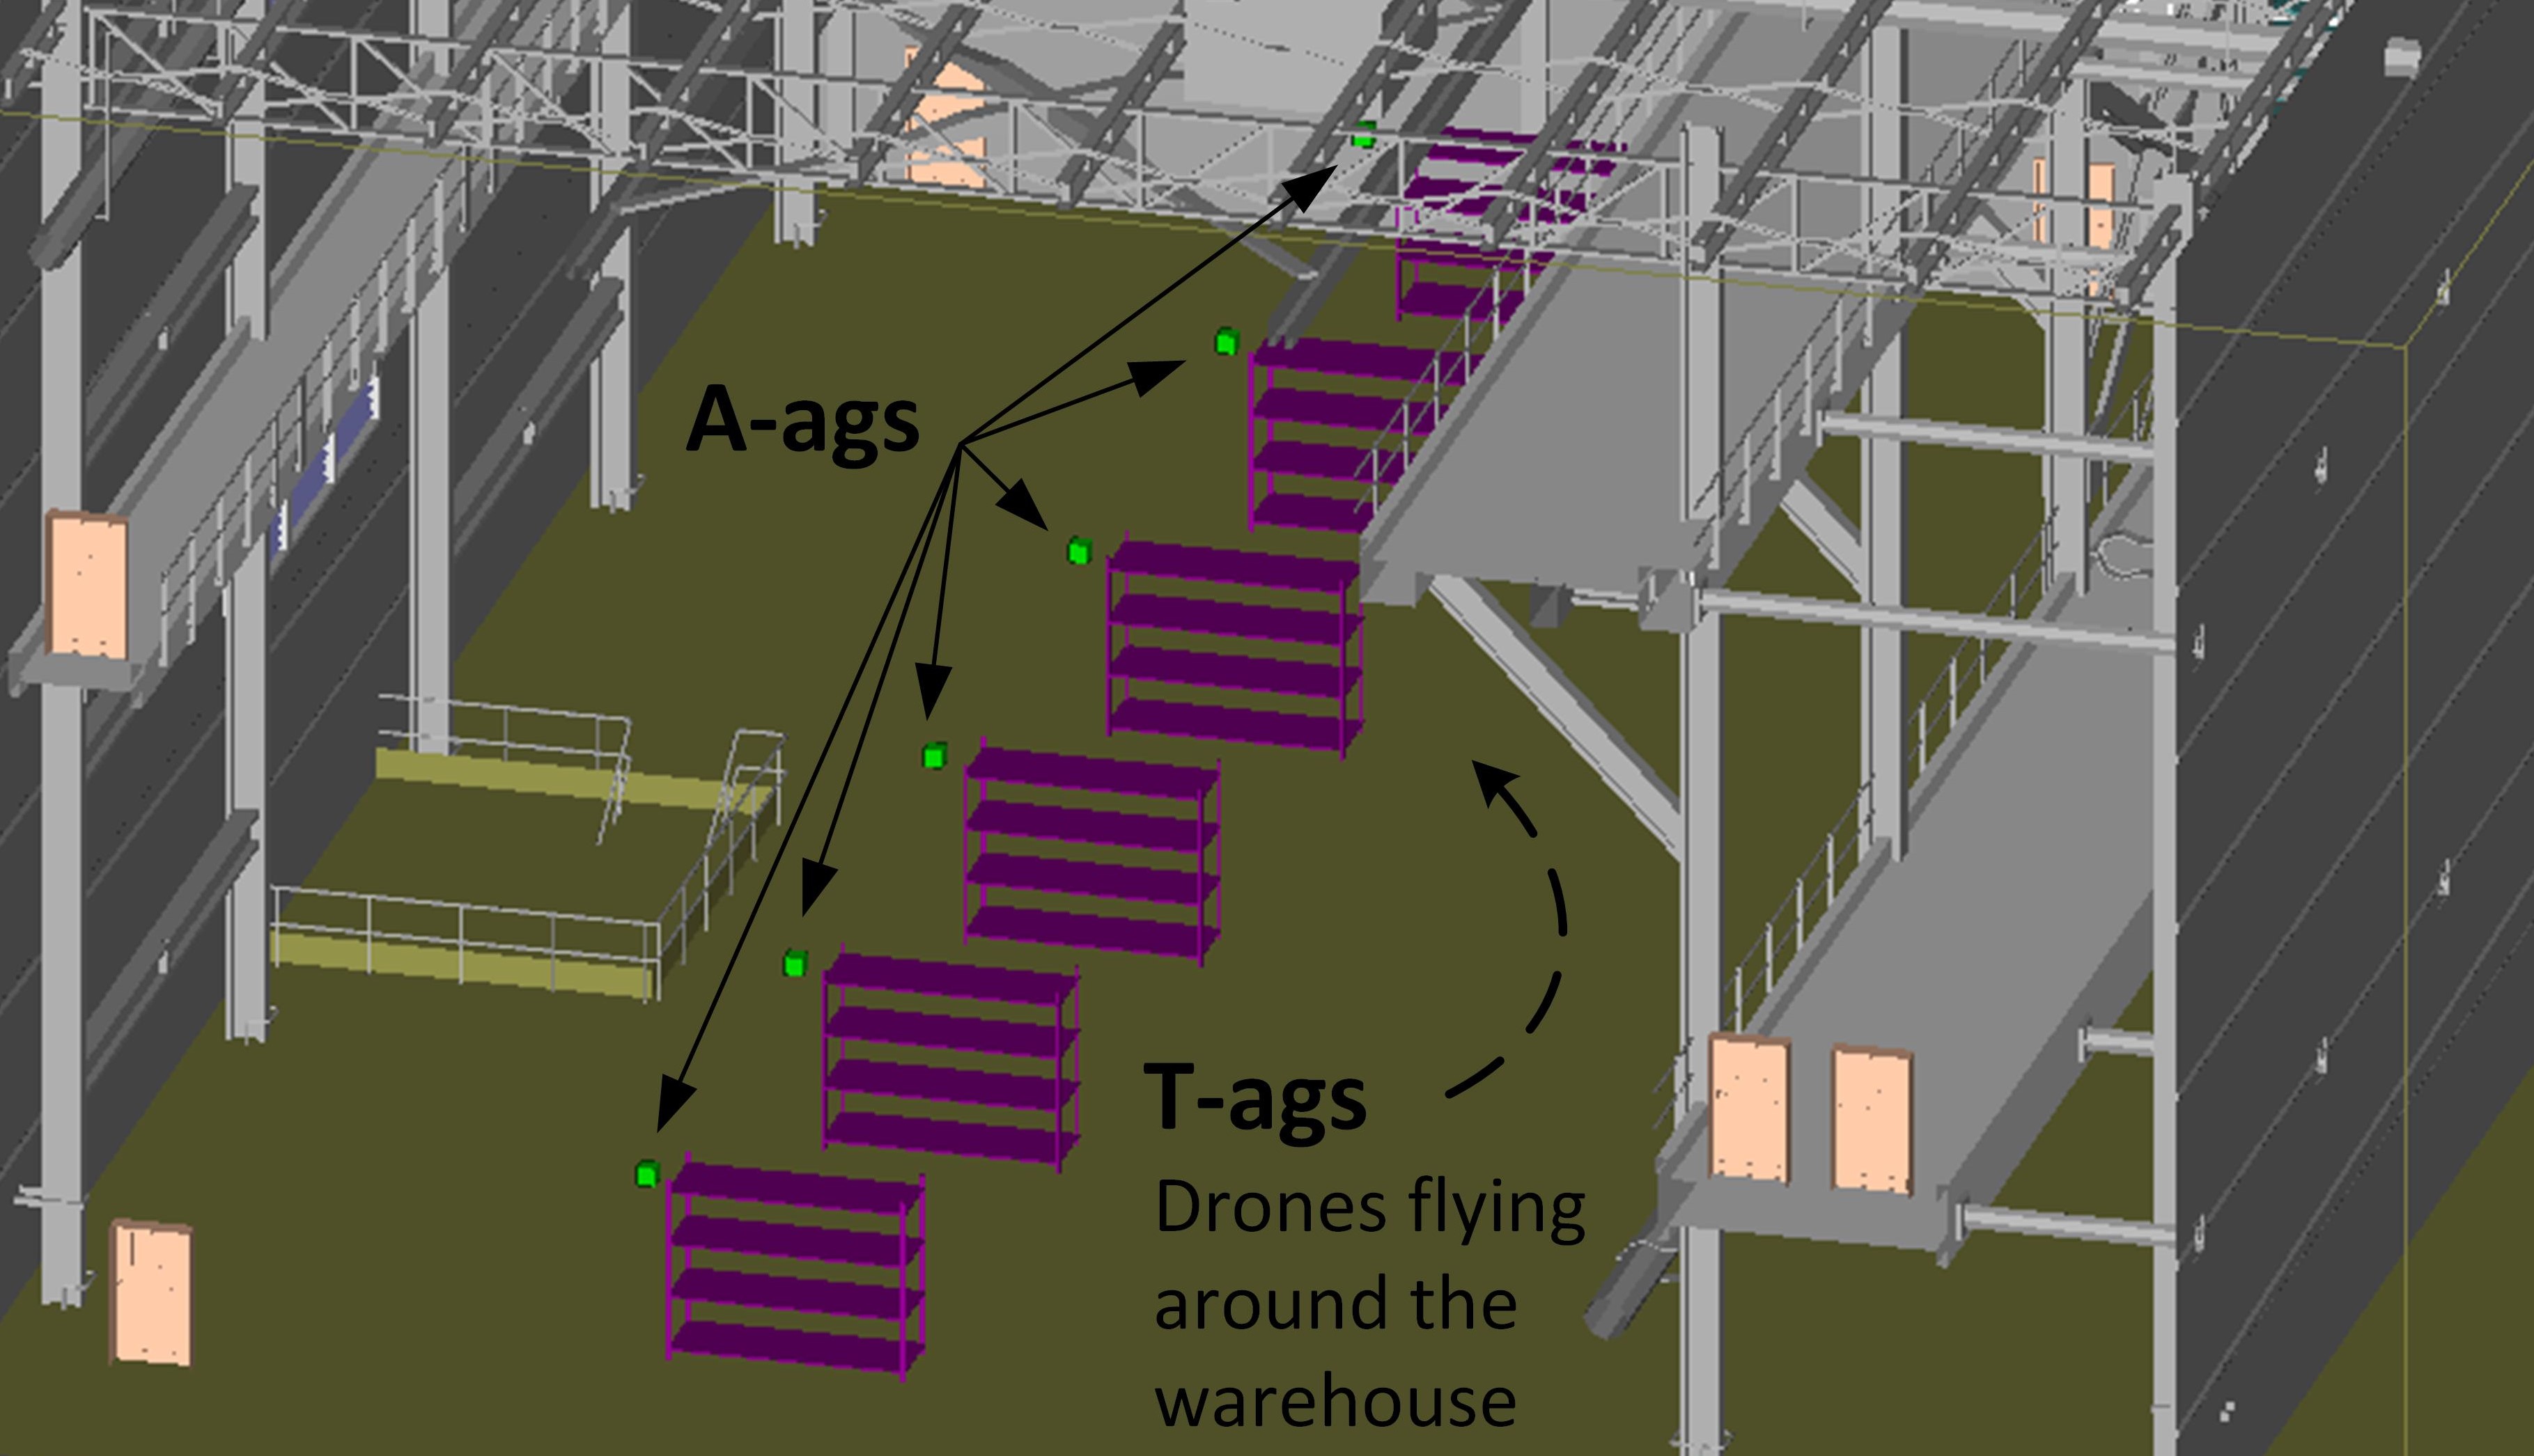
Figure 2. An illustration of the applied industrial factory warehouse for CPS with collinear deployed anchor agents (A-ags)
The performance of CPS of one trial based on the scenario in Fig. 2 is shown in the video below. TDoA and AoA are utilized for positioning. For the details therein, please refer to the descriptions given on top of the page.
Video 3
References:
[1] 3GPP, TR 38.901 V16.1.0, “Study on channel model from frequency 0.5 GHz to 100 GHz (Release 16),” Dec. 2019.
[2] 3GPP, TS 38.211 V16.1.0, “Physical channels and modulation (Release 16),” March 2020.
[3] 3GPP, TR 38.885 V16.0.0, “Study on NR Vehicle-to-Everything (V2X) (Release 16),” March 2019.
Videos are prepared by Yi Lu.