MARIA BÄCK
When examining country levels of generalized social trust, much of the explanation can be found in the degree of corruption and economic inequality in these countries. Low-quality governments and social systems appear to have massive negative effects on the welfare and health of modern societies, and at the same time, on levels of generalized social trust. Based on prior comparative studies, there are clear links between generalized social trust, on the one hand, and corruption and economic inequality on the other.
According to previous research (e.g. Rothstein 2003; Rothstein & Uslaner 2005), when examining country levels of generalized social trust, much of the explanation can be found in the degree of corruption and economic inequality in these countries. Low-quality governments and social systems appear to have massive negative effects on the welfare and health of modern societies, and at the same time, on levels of generalized social trust.
Based on prior comparative studies, there are clear links between generalized social trust, on the one hand, and corruption and economic inequality on the other.
The theoretical foundations are as follows: first, governmental corruption leads to decreasing levels of generalized trust because people make inferences from the information they have and receive about how society works, which they, in turn, get from how they perceive the action of public officials. If the perception is that “since one has to employ illegal or unethical measures to obtain the needed services or benefits”, then it is likely that other people are prone to do the same, and are therefore not to be trusted.
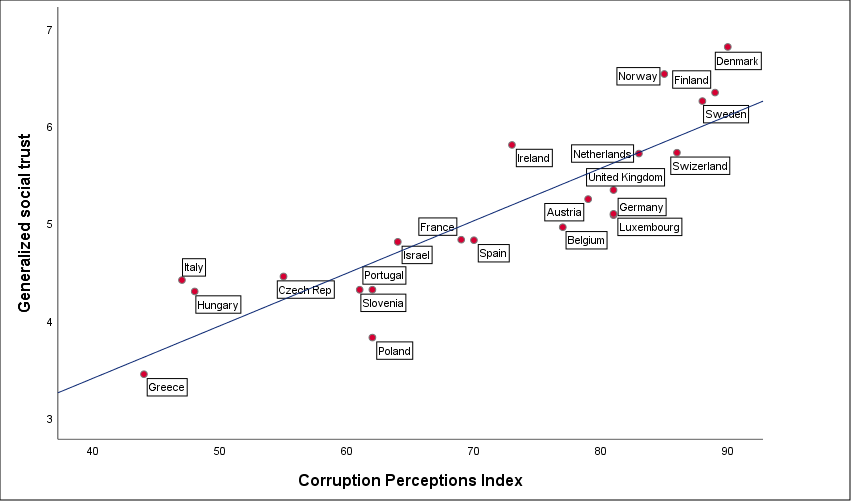
Figure 1 illustrates the country-level connection between generalized trust and corruption (see Notes for explanations of variable coding). As can be seen, the least corrupted European countries demonstrate the highest levels of trust.

Secondly, when it comes to economic inequality, the theoretical rationale is that social and economic inequality creates rifts between “us” and “them”. This has a negative impact on generalized trust, because such rifts makes it harder for people to feel that “we are all in the same boat”.
If there is a feeling that we share the same problems and the same fate with the unknown other, people tend to act morally right and trust people in general, even if they do not share the same social and/or economical background.
Figure 2 plots the relationship between generalized trust and economic inequality (see Notes for explanations of variable coding). The figure shows that countries that experience higher levels of economic inequality also demonstrate lower levels of generalized trust. The connection is not as strong as it is when looking at levels of corruption, but it is still statistically significant.

While it has to be recognized that multiple variables play a role when determining levels of social trust, it is clear that at least these two country-level factors need to be taken into account when evaluating country-level differences in generalized trust.
On a more negative note, both corruption and economic inequality appear to be sticky phenomena that are not easily uprooted, and they often tend to occur at the same time in the same countries.
Notes: Data for generalized social trust come from the European Social Survey 2016. Generalized trust is measured as the average (mean) of a sum variable, consisting of the following three survey questions: Generally speaking, would you say that most people can be trusted or that you can’t be too careful in life? Would you say that most of the time people try to be helpful, or that they are mostly just looking out for themselves? Do you think most people would try to take advantage of you if they got a chance, or would they try to be fair? All questions were initially measured on a scale from 0 to 10, where 0 indicated a most negative evaluation and 10 indicated a most positive evaluation. The sum variable was recoded to also vary between 0 to 10. The Corruption Perception Index (CPI) is a measurement tool created by Transparency International, and consists of both expert evaluations and opinion surveys. The index varies between 0 (no corruption at all) to 100 (very corrupted). Data come from evaluations of 2016. In order to measure economic inequality, the Gini-index is used. The Gini-ratio represents the income/wealth distribution of a nation’s residents, and varies between 0 (complete equality) and 1 (complete inequality). The score was recoded (multiplied with 100) and reversed in such a manner that low scores indicate high economic inequality and high scores indicate economic equality.
Literature:
Rothstein, B. (2003). Sociala fällor och tillitens problem. Stockholm. SNS förlag.
Rothstein, B., & Uslaner, E. (2005). All for All: Equality, Corruption, and Social Trust. World Politics, 58(1), 41-72. doi:10.1353/wp.2006.0022
Maria Bäck is PhD. and researcher at the Social Science Research Institute at Åbo Akademi University. She is also in charge of WP1 in the Contre-project. E-mail. maria.t.back@abo.fi

Comments